

Building the same report every Monday, by hand?
Excel, Sheets & Power BI with AI: analysis, dashboards and the story behind the numbers, in 2 weeks, live.
For managers, analysts, finance, HR, sales and operations, with zero code: AI inside Excel and Google Sheets, every figure checked, a Power BI dashboard and a deck leadership reads, with placement support and a certificate an employer can verify.
Taught live by industry experts from Mastercard and Paytm.
★ 4.7 from our pilot batch · 4,200+ learners trained by SkilD · learners at 39+ companies
Free · 90 minutes, live with our faculty · next date announced soon

Thirty people from different functions, sharing what works in theirs.
The Monday Numbers, and three builds on the way to it.
Resume, portfolio review, mock interview, job alerts and introductions.
Named after your project, so an employer sees the work.
AI skills and salary: 25–45% increases within a year of moving into AI.
Every team now has AI tools. The people who can put them to work are scarce, and companies pay for scarce skills.
- 25–45%Salary increase within a year, for people who move into AI roles
- 30–40%Hike on a job switch for scarce skills, against a 9.1% average
- ₹25 LPAAverage base pay, AI Product Manager
TeamLease Digital, 2025 · Michael Page India Salary Guide 2026 (9.1% is the average hike) · Glassdoor India, AI Product Manager, 2026.
Who Excel, Sheets & Power BI with AI is for: a dashboard course for working professionals.
People whose week runs on spreadsheets and reports, and who want the numbers faster, checked and on a dashboard.
Manager or team lead→ The numbers, at a glance
A dashboard that answers the three questions leadership asks, refreshed without rebuilding it.
Finance or HR→ The monthly pack, faster
The MIS or the attendance summary built with AI in the sheet, every figure checked before it goes out.
Sales or marketing→ A story, not a table
What-if scenarios and a deck that turn the pipeline numbers into a decision.
Operations or an analyst→ From export to dashboard
A messy export questioned in plain English, then shown in Power BI or Looker Studio.
- Zero code, at any point: a spreadsheet is all it assumes
- Your weekend mornings for two weeks, live
- A laptop and a browser; Power BI Desktop and Looker Studio are free
- English you can follow in a live class
PG Program · AI Generalist: 22 weeks to the AI lead role in your function.
These two weeks run inside the program. The program adds your AI system, automation with n8n, no-code agents, a function track and a business case presented live to a panel.
Six tools offices already use, free to start, and AI inside every one.
Every tool is set up with the helpline before the first live session. Copilot in Power BI needs a paid licence, so the faculty show it and you practise on the free equivalent.
- Nothing to buy. Any laptop from the last five years, and a browser
- Power BI Desktop and Looker Studio, both free
- A Google or Microsoft account for Sheets or Excel
- A free account on an AI assistant, opened with the helpline
Stuck on setup? WhatsApp the helpline and someone walks through it with you. The dashboard and the deck you build are yours to keep.
Analyse it. Check it. Show it.
The full Excel, Sheets & Power BI with AI syllabus: two weeks, two parts, and a dashboard put to use at work the week after.
Analysisweek 1 · 6 hrsYou leave able toAnalyse numbers with AI in the sheet, check its arithmetic, and build a dashboard.
- W1AI-assisted data analysisAI in Excel and Google Sheets · validating AI-generated calculations · dashboards in Power BI Desktop and Looker Studio · Copilot in Power BI (demonstration)Build: a dashboard from a working sheet, every figure checked6 hrs
Scenarios and the storyweek 2 · 6 hrsYou leave able toModel what-if scenarios, and turn the numbers into a story leadership acts on.
- W2Scenario analysis and data storytellingWhat-if scenario analysis with AI · data storytelling · AI-generated presentationsBuild: The Monday Numbers6 hrs
The Monday Numbers · Excel, Sheets & Power BI with AI
A dashboard and a short deck from a working sheet, with a what-if scenario and every figure checked, and resume lines to explain in any interview.
The detailed Excel, Sheets & Power BI with AI syllabus and the timetable, in one PDF.
- Every topic, week by week
- The timetable, with dates
- The tools, and the setup guide
- The Monday Numbers brief
Download it now. The helpline is on WhatsApp if a question comes up.
Your syllabus is ready.
Questions? The helpline answers on WhatsApp.
Taught live by industry experts who build the numbers teams run on.
They answer in the cohort chat between sessions, and review the work you hand in.




Get your two-week plan, mapped onto your own reports.
Leave your number and a program advisor calls within one working day with a plan built around your work: the report worth turning into your dashboard first. Or WhatsApp the helpline now.
Your plan is on its way.
A program advisor calls within one working day to walk through it.
Three things that make two weeks fit a working week.
Hands-on, from week one
Every week ends in something put to use at work the week after, reviewed by the faculty.
The tools offices already use
Excel, Google Sheets, Power BI and Looker Studio, free to start.
Built around a full-time job
Weekend mornings, and every class recorded and up within 24 hours.
What a week looks like alongside a full-time job.
Everyone moves through the same week on the same deadline, with the same thirty people.
- 01The brief, firstWhat you’ll build this week, and what done looks like. Before the session, not after.
- 02Build it with the facultyOn screen with the faculty, chat open, your question answered on the call.
- 03Use it at workStarted in the session, finished by the deadline, on a sheet from your working week.
- 04Reviewed, every weekYour work checked by the expert who set it, so you know where you stand.
- 05Bring what brokeAsk in the cohort chat, or bring it to the next session.
One project leadership can read: the Monday Numbers, a dashboard and a deck with every figure checked.
It runs on numbers from your own work, and it is finished when the dashboard, the deck and your recalculation agree.
The Monday Numbers: the three questions leadership asks, answered on one dashboard.
You take a sheet you or your team update every week, question it with AI in Excel or Google Sheets, and check every figure the AI gives you. Then you build the dashboard in Power BI Desktop or Looker Studio, model one what-if scenario, and turn it into a short deck that says what the numbers mean.
- How it works
- Week 1 builds the analysis and the dashboard, with the AI’s arithmetic checked. Week 2 adds the what-if scenario and the story, then the deck.
- Where it is used
- The same shape builds a manager’s weekly review, finance’s monthly MIS, HR’s attendance summary and a sales team’s pipeline report.
- What it proves
- That you can turn numbers into a decision, and stand behind every figure on the slide.
- What it does
- Turns a weekly sheet into a checked dashboard, a what-if and a short deck.
- Tech stack
- ExcelGoogle SheetsPower BIGamma
- Key challenge
- Checking the AI’s arithmetic before a number reaches the slide.

Three builds on the way
Each one becomes a piece of the Monday Numbers.
Spreadsheet Answers, Checked
Plain-English questions answered from a working sheet with AI in Excel or Sheets, and every figure recalculated once by hand.
Done when: the AI answer and your recalculation agree.
Proves the ability to trust an AI’s number, because you checked it.
The First Dashboard
The sheet turned into a dashboard in Power BI Desktop or Looker Studio, with the three numbers leadership looks at first.
Done when: the dashboard matches the sheet.
Proves the ability to show numbers at a glance.
One What-If
One scenario modelled with AI: what happens to the month if a price, a cost or a volume changes.
Done when: the scenario’s totals tie back to the base sheet.
Proves the ability to answer “what if” before anyone asks.
The faculty who teach it review every project.
Placement support: five steps from the course to a role that asks for dashboards.
The Monday Numbers is the raw material. These five steps put it in front of hiring teams, for a new role or a bigger one where you work now.
- 1Week 2Your resume and LinkedInRewritten around the Monday Numbers and reviewed line by line.
- 2Week 2Your portfolio reviewThe dashboard and the deck checked against what a hiring manager opens first.
- 3After week 2A mock interviewA reporting round with an industry expert: the dashboard walked through and one question answered live, recorded and reviewed.
- 4From week 2Job alertsOpenings that ask for Excel, Power BI and AI skills, on WhatsApp, as they open.
- 5From week 2IntroductionsTo hiring teams in the SkilD network, as roles open.
Check your resume against these roles first → · Going for the AI lead role? See the PG program →
Our learners work at 39+ companies.
Where people who learned with SkilD work now.


 amazon
 Swiggy

 Twitter

 ByteDance
 PayPal


 Flipkart


 ATLASSIAN

Training a team? 12+ organizations bring us in to train their own people, on their own work. Plan a program for your team →
Every office has the numbers. The trust goes to the people who check them.
The spreadsheet is free. A figure you can stand behind is scarce.
AI can now answer a question from a sheet in seconds, and sometimes it is wrong. The people trusted with the review are the ones who check the arithmetic, show it on one page and say what it means. These two weeks build that habit.
One Excel, Sheets & Power BI certificate an employer can verify by its ID.
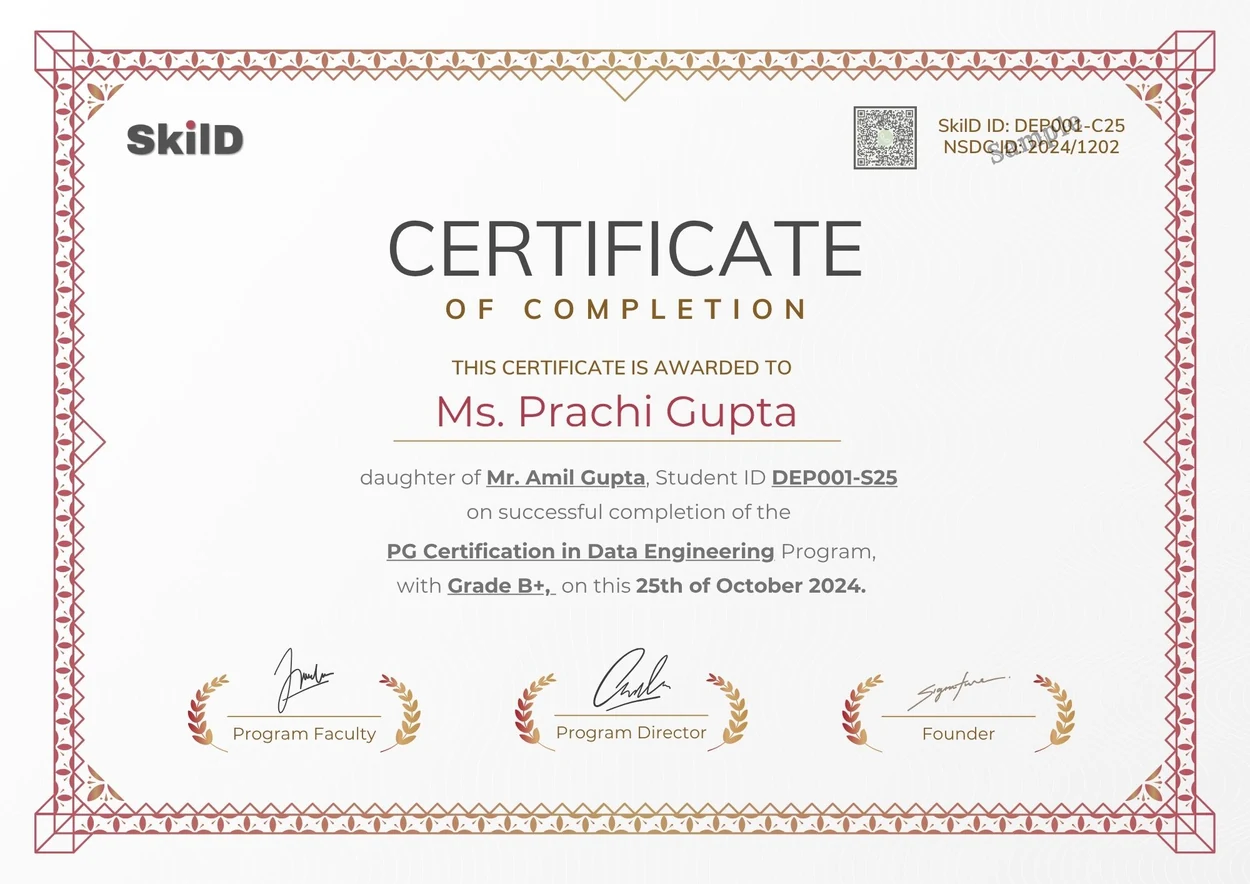
Awarded when your project is complete and every build passes its review, with a verification ID anyone can check.
Awarded by SkilD on completion, and checked at skild.co.in/verify. It names the Monday Numbers, so an employer sees the work itself, with the ID to prove it.
One fee for the Excel and Power BI course, everything included.
About ₹583 a live hour.
- Both weeks, taught live
- The Monday Numbers and three builds on the way
- Placement support
- Every session recorded
- The weekday doubt channel and the Saturday doubt clinic
- The certificate
Training a whole team? Plan it with us →
Why two weekends, live?
Plenty of ways to learn Excel and Power BI. Here is what each one usually gets you.
| The route | What it usually gets you | What 2 weeks here gets you |
|---|---|---|
| YouTube and free courses | Formula tricks on someone else’s sheet, and nobody to ask when your own sheet will not add up. | Your own sheet, and the faculty answering in the session. |
| A recorded course | Videos you mean to finish. | A live session every weekend, a deadline that keeps you moving, and placement support after. |
| A one-day workshop | A burst of shortcuts, and the same report on Monday. | Two weekends, each one put to work on your own report the week after. |
From enrolment to your first Saturday.
- 1EnrolTwo short steps
- 2Pay onceYour seat is held for this cohort
- 3Join the cohort groupOn WhatsApp, with your batch
- 4Setup callWith the helpline, before day one
- 5First live sessionOnline, with your faculty
10 AM to 1 PM IST. Bring one sheet from your week.
Seat confirmed. Welcome to the February cohort.10:02
- ✓Excel
- ✓Google Sheets
- ✓Power BI
- ✓ChatGPT
The joining link for Saturday is pinned above.Fri 6:00 PM
- IReverse-Engineered CurriculumWe plan your learning backward from the career outcome you want.
- IICurated AdmissionYour advisor recommends a path only when it matches your background and ambition.
- IIIResponsive SyllabusYour cohort shapes the curriculum. When your batch asks for a topic, we add it.
- IVIndustry-Standard ToolsYou learn live, on the software and platforms the industry uses today, with no simulations.
- VBuild to ProveEvery project you finish becomes a portfolio asset.
- VISystems ThinkingWe teach you to design the whole system before you build any part of it.
- VIIExpert ValidationYou present your projects to industry veterans and explain the choices behind them.
- VIIILifetime Placement SupportOur support doesn't end at graduation; it accelerates your career long after your last class.
Enrol in Excel, Sheets & Power BI with AI.
Two short steps, then payment. About three minutes.
Details saved.
One more short step, then payment.
Excel, Sheets & Power BI with AI · cohort begins Sat 6 Feb 2027
GST included. Pay securely online. Course access and cohort details follow on email and WhatsApp.
You are enrolled.
Your confirmation and the cohort WhatsApp link arrive within minutes. The helpline sets you up before day one.
Excel and Power BI course: your questions, answered.
Do I need coding for the Excel and Power BI course?
No. Zero code at any point. A spreadsheet is all it assumes, and the helpline sets up every tool before the first session.
What will I be able to do after the course?
Question a sheet with AI in Excel or Google Sheets and check its arithmetic, build a dashboard in Power BI Desktop or Looker Studio, model a what-if scenario and turn the numbers into a short deck.
Does the course teach Copilot in Power BI?
The faculty show it, because it needs a paid licence. You practise on Power BI Desktop and Looker Studio, which are free, and the same habits carry over.
Is this an Excel course or a Power BI course?
Both, with AI in each: the analysis in Excel or Google Sheets, the dashboard in Power BI Desktop or Looker Studio, and the story in a deck.
Who can enrol in Excel, Sheets & Power BI with AI?
Anyone who works with spreadsheets and can follow a live class in English: managers, analysts, finance, HR, sales and operations, at any level.
Can I take it if my employer restricts AI tools?
Yes. Every build can run on your own accounts and practice files, and nothing confidential goes into an AI tool.
Can I talk to someone before I enrol?
Yes. WhatsApp the helpline, or ask for a call back and a program advisor calls you with your two-week plan.
How much time does the course take?
Two weekends, Saturday and Sunday mornings, plus a little practice at work.
What are the course fees?
₹6,999 including GST, once. It covers both weeks taught live, the Monday Numbers and three builds, placement support and the certificate.
What if I miss a session?
Every class is recorded and up within 24 hours. Watch it, then bring your questions to the Saturday doubt clinic.
Do I get a certificate?
Yes, with a verification ID an employer can check. It is awarded when the Monday Numbers is complete and every build passes its review.
Is there placement support after the course?
Yes, in five steps: your resume and LinkedIn, a portfolio review, a mock interview, job alerts and introductions to hiring teams in the SkilD network, as roles open.
What comes after the course?
The PG Program · AI Generalist, if you want the whole road to the AI lead role in your function.
Two weekends from now, the Monday report could build itself.
AI in your sheets, every figure checked, a Power BI dashboard, a deck leadership reads, and placement support, for ₹6,999.
Want to look first? Download the syllabus or get a call back.
Data and AI openings on WhatsApp, and the hiring market twice a month.
The roles the companies our learners work at are hiring for. Read three issues of the Brief and you’ll know whether we’re your kind of school.
You’re on the list.
The first alert lands the next time our network is hiring, and the next Brief lands in your email.
Book a 1-on-1 call with a program advisor.
Thirty minutes on the syllabus, the dates and the fee, and which program fits where you want to go.